iOS 13 – Swipe to Type

iOS 13 has brought along a lot of interesting new features and one of these which i’ve started using is Swipe to Type. I’ve been quite impressed by the accuracy.

This functionality has long been around for a long time in third party apps and has been a native function in Android (I think) for some time.

What does the native iOS version look like under the hood?

Swipe to Type – Files of interestingness

/private/var/mobile/Library/Keyboard/shapestore.db

This database contains much the same content as you’d expect to see in the dynamic-text.dat dictionary file. The only apparent useful table is called shapes and this stores the swiped word as string_representation, there is also a blob entry for shape_data which presumably stores data relating to gesture tracking accuracy, however this is just an assumption.

/private/var/mobile/Library/Keyboard/user_model_database.sqlite

This database appears to be the real interesting one. There are a few tables in this database but the ones we would be interested in are:

  • usermodeldurablerecords 
  • usermodeltransientrecords

usermodeldurablerecords 

This table seems pretty basic, it shows a total number or typed words and the number of words pathed, presumably this second value relates the number of words created through the Type to Swipe feature.

Screen Shot 2019-09-23 at 12.46.43 pm

usermodeltransientrecords

This table has a number of fields or keys relating to user activity on the keyboard:

  • tium.wordsTyped
  • tium.pathEligibleWordsTapped
  • tium.durationTappedWords
  • tium.wholeWordDeleted

I have not figured out which each of these relate to as yet, although some will be quite obvious, and as you can see there are last update timestamps.

Screen Shot 2019-09-23 at 1.52.25 pm

When paired with messaging activity in the SMS.db, web browsing or other application data, this will make good evidence for identifying when a user was actually interacting with their device.

Further work is required but this is a nice new artefact which can be in the investigators toolkit for finding evidence of hands-on device usage.

Event ID 1024

As i’m sure i’ve mentioned before, event logs are a great source of evidence when performing incident response. In particular, lateral movement can be one of the hardest things to identify when investigating network based intrusions.

Event ID 1024 in log file Microsoft-Windows-TerminalServices-RDPClient%4Operational.evtx is an event that can sometimes be overlooked and it relates specifically to ActiveX controls in remote desktop.

In built ActiveX controls allow an administrator to configure the RDP user experience by providing scriptable interfaces and can allow embedding RDP ActiveX control in web pages and configuring URL security zones, as a couple of examples.

Screen Shot 2019-09-22 at 1.00.34 pm

Event ID 1024 which contains the following message:

“RDP ClientActiveX is trying to connect to the server (IP.ADDRESS OR HOSTNAME)”

Whether IP or hostname display here, will depend on what is entered in “Computer” files in the GUI for remote desktop.

Screen Shot 2019-09-22 at 12.59.55 pm

This event ID appears (in testing) to be generated when a user initiates an RDP connection using the RDP client MSTSC.exe in Windows by pressing ‘connect’.

The great thing is, event 1024 entries will be created whether a session is connects or not.

This means while an attacker may not have successfully connected via RDP to another computer, we may still see evidence of their attempts. This log may also persist longer than other logs too, where a Security log may only cover a days worth of activity, you may find months worth of evidence in this log.

When paired with 4648 Security events and other remote computer RDP logs, this can show both attempted or successful connection and authentication to a remote (target) computer.

Reference:

https://nullsec.us/windows-rdp-related-event-logs-the-client-side-of-the-story/

https://www.ultimatewindowssecurity.com/securitylog/encyclopedia/event.aspx?eventID=4648

https://ponderthebits.com/2018/02/windows-rdp-related-event-logs-identification-tracking-and-investigation/


4625 Events – Know your enemy

One of the interesting things about brute-forcing accounts and passwords effectively is that it requires either some prerequisite knowledge of the target, accounts, passwords or at very least some high level information about how and where they operate. Most account names in spraying attacks tend to be the day-to-day combinations of administrator, manager, reception, finance and so on. We do however, sometimes see account name usage which appears to be more specific. This occurs when an attacker has somehow captured or identified previously exposed credentials.

4625 Security events are a great place to see account and password spraying attacks against poorly configured RDP services. Unfortunately, the systems where we see these kind of attacks occurring are usually poorly configured. This means that logging generally doesn’t tend to surpass the Windows default retention period and the only place we may be able to look for further logs is in backups, if they exist.

However, if we have identified brute-force activity and we have access to logs going back far enough, we might be able to pull some extremely useful information from them.

When it comes to attribution, we can spend a lot of time looking for evidence of known domain or local accounts being compromised and used by the attackers. By focussing solely on these elements we may sometimes overlook the obvious.

One thing I like to do during initial log review is to spend some time scrolling and looking for any strangeness, patterns or commonalities in the data. As I mentioned before, the majority of account names that feature in RDP brute-force attacks tend to err toward standard expected account names, sometimes combined with a mixture of account names in other languages like Spanish, French or German.

What sort of account names have we seen used which may provide further information about the attacker?

  • Use of specific external domain names owned by the company (trump@trumptowers.com)
  • Use of mail account names for users in the company (donald.trump@trumptowers.com)
  • Use of named users in an environment (donald.trump)
  • Use of external domain names or mail addresses in the same country owned by external companies (barack@obamacare.com)
  • Use of external domain names or mail addresses in other countries owned by external companies (barack@obamacare.co.uk)

What does all this mean?

We should always try to remove ourselves from the specifics of an investigation and try to take a wholistic view. This might give us some useful insight to the attackers overall knowledge of the company, general capabilities and overall sophistication of the attacker based on their word lists. Lastly, you may also identify a potential compromise of a third party system through your review, which can lead to some interesting legal discussions.

Thanks for reading, happy logging!

Evernote for iOS

Overview

New iOS applications are always coming up in our forensic examinations. I’ve found that commercial tools we commonly use to acquire and analyse data from mobile devices are not able to parse the majority of third party apps. This is an inherent issue with the app update cycle. We can’t really blame those commercial products or developers, they really are fighting a futile battle.

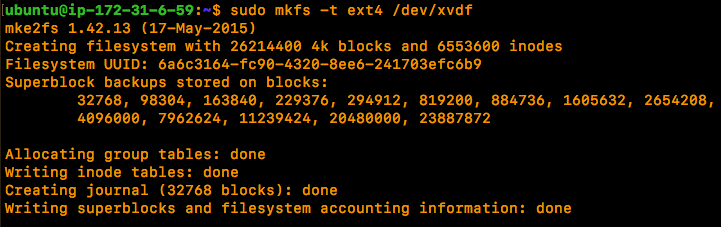
So for this piece of testing, I used some open source tools to acquire a backup of my iPhone 7 running iOS 12.1.  I’ve been using Evernote for a number of years but oddly have never really come across it during the course of an investigation.

More recently I have been using the Evernote application on my phone to access shared teaching notebooks created by course instructors and discovered some really interesting artefacts relating to logging and locations.

I won’t go into too much of the information you can acquire from the Evernote plist and database files stored by the application, but here are some of what I consider to be some more interesting findings:

Application Logging

Evernote retains a number of logs relating to application usage on iOS and these logs contain a statement about their intended purpose, which is rather handy:

“The Activity Log contains a detailed list of the steps the Evernote application performs, as well as information about your account, your device and location information (if enabled). Your Note titles, tags, Notebook names and occasionally Note content also may be included. We treat your Activity Log data as confidential, and the terms of our Privacy Policy (https://evernote.com/privacy) apply.If sending your log to Evernote, you may want to email the file to yourself and edit out any sensitive information first.”

Based on this statement alone, it’s clear to me as a bit of a log monkey that I’m going to be drawn to these.

The logs are stored in the following location in iOS:

iOS-Backup/Documents/Logs

As you will see from the log names below, they follow a standard naming convention and a quick look at the file names shows us some useful timeline information. I haven’t used the app particularly often but the dates in the table below, specifically relate to the days in which I was attending the teaching events I previously mentioned.

com.evernote.iPhone.Evernote 2018-04-21--21-39-27-026.log

com.evernote.iPhone.Evernote 2018-05-04--02-28-25-844.log

com.evernote.iPhone.Evernote 2018-05-09--01-59-14-135.log

com.evernote.iPhone.Evernote 2018-05-17--07-12-09-464.log

com.evernote.iPhone.Evernote 2018-07-21--03-38-13-286.log

com.evernote.iPhone.Evernote 2018-08-23--07-51-43-715.log

com.evernote.iPhone.Evernote 2018-11-07--10-17-36-152.log

A simple cat command across these files will allow us to aggregate them for bulk searching:

cat /logs/*.log > /new-logs/All-evernotelogs.log

Some useful information we can gather from these logs includes:

  • Evernote username
  • Hardware (iPhone Model) and iOS version at the time when the log was created
  • Carrier in use when the log was created
  • Note titles

There are many timestamps stored in these logs and clearly a fountain of information relating to application functions, user activity and previous devices which may have been used by the subject.

There were a number of entries which I found interesting and these lines contained the text “Preview updated“. In most occurrences, there were note titles appearing but some of the entries appeared to be error entries.

Screen Shot 2018-11-28 at 10.54.26 pm

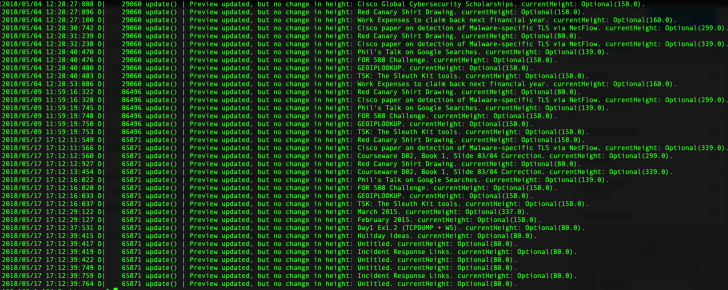
As you can see there’s some repetition here, which is why I believe these log entries directly relate to the previewing of the note that is shown to the user on-screen when the application is launched. This would be useful in proving knowledge of notes or device usage at a specific time.


Geo-locating third parties via Database files

So, when I set out on this journey I expected we might find that there are some databases containing notes and other things like usage history and content. What I didn’t expect to find was very specific information relating to the movements of the individuals who have shared their notebooks publicly.

I pulled the following database out to examine:

iOS-backup/Documents/pending/3*2*9*1-personal-www.evernote.com/LocalNoteStore.sqlite

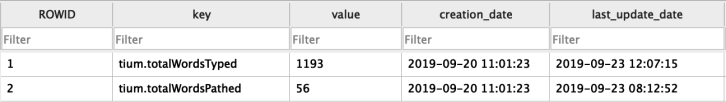
This database contains a pure mountain of Evernote goodness, which may be of forensic interest:

  • Timestamps: note created, deleted, last viewed, last updated and date shared
  • Note Author: Often this is the email address used to register the Evernote account
  • Last Evernote user to edit a note: As above
  • Note Title
  • Note URL
  • Latitude, Longitude and Altitude for the note creation: If location services are enabled when the note is created
  • Source application: iPhone, web browser or Mac (These were the methods I tested, there may be others for Android)

I wrote a quick SQL query to parse out some of the relevant information from the ‘ZENNOTE‘ table which contained all of the relevant note information:

Select DateTime(ZDATECREATED + 978307200, 'unixepoch') as 'Date Created (UTC)',
DateTime(ZDATEDELETED + 978307200, 'unixepoch') as 'Date Deleted (UTC)',
DateTime(ZDATELASTVIEWED + 978307200, 'unixepoch') as 'Date Last Viewed (UTC)'
DateTime(ZDATEUPDATED + 978307200, 'unixepoch') as 'Date Updated (UTC)',
ZAUTHOR as 'Note Author', ZTITLE as 'Note Title', 
ZSOURCEURL as 'Note URL', ZLATITUDE as 'Latitiude', 
ZLONGITUDE as 'Longitude', ZSOURCE as 'Source', 
ZSOURCEAPPLICATION as 'Source Application'
from ZENNOTE

As you will see from the query above and some sample results below, we can determine many timestamps related to specific notes. We can also see the application used to create the note, either mobile or desktop (Source), the author’s name (Note Author), the source URL for the note and most importantly the Geo-location information.

Evernote-localnotestore

The Evernote shared notebook I identified most of the valuable information was shared by the instructor (Note Author) of a teaching event I attended. This seemed like the most useful for review.

The first thing I did was take a look at one of the locations which featured in the shared notebook and punched the coordinates into google maps to see what was going on.

Screen Shot 2018-11-28 at 11.17.23 pm.png

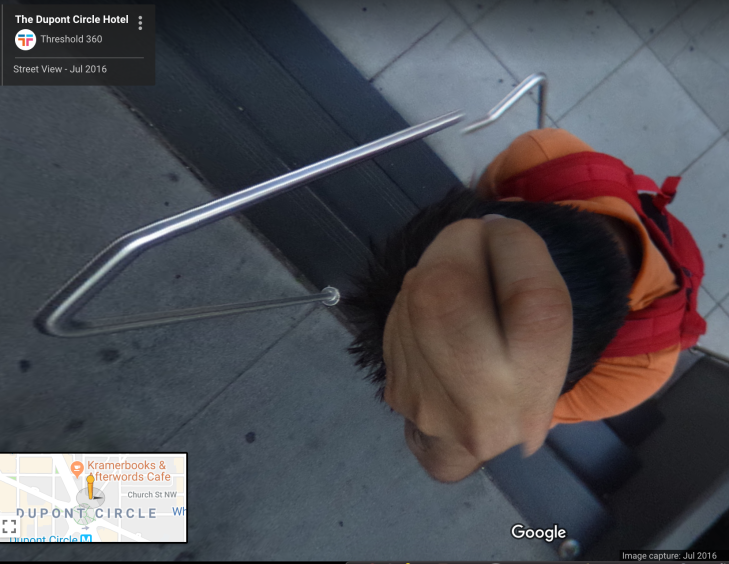
It looks like the Note Author may have spent some time at the Dupont Circle Hotel in Washington back in 2016. It appears from the geo-location information that the hotel was actually mobile at this point and positioned on top of this young man’s melon.

I looked closer at the extracted database entries and quickly identified a number of locations where notes were created or added to the Note Author’s notebook by filtering on the Note Author column. There were a number of entries with locations associated. These ranged from Singapore and London to multiple spots across the United States.

Most of these locations appeared to be hotels, although a residential address appeared a number of times too, which I suspect was the Note Author’s home address.

It should be noted that most of this geo-location information appears to have been added by using the Evernote desktop application rather than the mobile application, although both allow locations to be added to notes. Enabling of location services and sharing of notebooks requires specific user interaction at the time of installation and shared notebook creation.

Why is this information interesting?

  • Many different users can add to shared, publicly accessible notebooks
  • We can track their activity over time through our own iOS device and EverNote account

What can we deduce?

  • Associated email addresses to device/app users (Note Author)
  • Other contacts with an individual (Last Edited By)
  • Activity relating to the application usage and specific notes (Note Title, Date Created, Date Deleted etc)
  • Location information over time (Lat, Long, Alt)
  • Devices used by specific individuals (Source)

How could this be abused?

  • Nefarious actors attempting to find information about an individual or many individuals, may find ways to scrape URL’s for publicly accessible Evernote Notebooks. This may allow them to leverage this information to gain knowledge of movements, locations such as homes for theft etc.
  • Once these Notebooks are subscribed to using an account on the iOS device that the nefarious actor is using, it would be trivial to dump the LocalNoteStore.sqlite file and find out all of this information, including work and business addresses.

Thanks for reading,

Update: Rather than publishing these findings at the end of 2018, I approached Evernote who have since disabled the sharing of note locations in public notebooks. Evernote were kind enough to feature me on their 2019 Security list of contributors.

Mac OS Daily Logs

Overview

I recently attended the awesome SANS DFIR, Mac and iOS Forensics and Incident Response course with Sarah Edwards. This has obviously given me lots of great inspiration on how to negotiate Mac analysis in general and to take a closer look at some of those system files that we covered in training.

I’ve spent a little bit of time digging through the log files on my MacBook (Mojave 10.14.2). I’m sure this isn’t new to most practised Unix beards but for those who aren’t aware, there’s a really great little log file called daily.out in /var/log. I had previously given little credence to this log but realised it can be used to determine a whole wealth of useful information. I also reviewed the weekly.out and monthly.out files but these were, in my case, far less granular.

At a high level daily.out contains information relating to disk usage and networking, this file is written at least daily and the configurations for all three of the periodic logs are stored in plist files in the following location:

/System/Library/LaunchDaemons/com.apple.periodic-*****.plist

After reviewing the content of this file, it made me consider how this might assist in some of my casework?

Disk Usage

Firstly, I borrowed some grep skills from a very knowledgeable and tall colleague on my team to see if we could parse out just some specific information from the daily.out file. We extracted the lines only containing the dates, followed by the lines which related specifically to disk usage.

grep -E -e "\w{3} \w{3} .\d (\d\d\:){2}" -e "(/dev/disk|Disk status|iused)" daily.out

From this, we were able to find entries dating back as early as 3 months, and that the log contains:

  • Logical volumes mounted at the time entries are written
  • Size of volumes
  • Space used on volumes

As you can imagine, disk volume information will be highly valuable in showing drives or images which were attached when the log was written and especially if you know the volume name used by a device you’re looking to prove access to.

We can also ascertain some other information from this log which is quite valuable.

Bootcamp!

Screen Shot 2018-12-11 at 9.37.25 am


You may have an instance where a suspect, subject or general bad person is saying they have never used their Bootcamp install, however, you can see from the Bootcamp disk usage that the volume is being written to and from regularly. Perhaps a big chunk of data has been deleted before a date of interest?

Uptime

Another interesting piece from the daily.out file is that it will show uptime of the system when the log entries are written. This could help prove whether or not the system was switched on and in use over a specific period.

This may also show some interesting information about account usage on the computer. As Mac computers generally tend to be used by individuals, this means there’s usually only ever one account logged on at any time. If you have an experienced user who is elevating to root every day, then seeing multiple accounts logged on may not be uncommon. Although, if an inexperienced user who has no knowledge of the root account, is logged on many times when another account is logged on, it may be suspicious or warrant further analysis.

Again, we extracted the lines from the daily.out file we are interested in using a simple grep command:

grep -E -e "\w{3} \w{3} .\d (\d\d\:){2}" -e "Local system status" -e "load averages" daily.out

As you can see we can pull some interesting information about computer and account usage:

  • Shows uptime of the system at the point in which the daily.out entry is written
  • Also shows the number of users logged on, remember this is usually going to be one

There are also some very useful network interface statistics listed in this file which are probably more relevant to IR investigations but we may look at these another time.

Reference:

Click to access summit-archive-1493741667.pdf

http://thexlab.com/faqs/maintscripts.html

AWS for Forensics (5)

Capturing Evidence from AWS

We previously discussed how to upload evidence into our AWS environment for analysis. This is something which clearly has benefits due to the ease of spinning up very high spec systems in a matter of minutes. In saying this, there are also inhibiting factors such as bandwidth availability, cost and legal issues which may arise. I don’t wish to cover too many of the technical elements, as there are mountains of information on Amazon’s site. We shall now cover some scenarios where we may need to capture evidence from AWS.

In any AWS evidence collection you are likely to require:

1: Appropriate access to the platform (if it’s not your own), including credentials and audit logging for your access.

2: Analysis systems (scope AWS specifications prior to starting) with a full suite of tools in the AWS environment or your clients.

3: A thorough understanding of the infrastructure, evidence sources, time frames and objectives.

4: Evidence naming convention to apply as tags to volumes or snapshots, which can be used for continuity, chain of custody, and later identifying your evidence volumes.

5: For larger environments, consideration on what you will do with any volumes, snapshots or AMI’s once your collection/analysis phase is complete. eg download or deletion

(At scale, this approach of image preservation will cost a number of bit-schmeckles. An exit strategy which allows for maximum data integrity, evidence continuity and cost-effectiveness will pre-empt any difficult cost implications or conversations for you further down the track)

Sharing Evidence between AWS Accounts

There may be a few reasons why you would want to share a particular snapshot from your target environment. The target environment may be compromised, they may not wish to have you on-site for a number of reasons or you may just want to share snapshots to your own as this is where you have all your beefy instances and tools configured.

To share a snapshot from your target environment you will need to establish which AMI or Snapshot you wish to acquire, create a volume from this and then share the volume to your own platform.

I won’t discuss hashing but it should be self-explanatory that you need to establish a level of certainty about your evidence, particularly when physically moving data through data centres or downloading from the AWS platform.

Once you have the volume moved to your own platform you will need to mount it read-only where you can proceed to interrogate it with forensic tools as you normally would.

You may wish to capture a forensic image of this volume at this time for continuity or for download and offline analysis. Depending on your case requirements and time constraints, you may also wish to interact with it directly in order to reach quick results.

Provided you have taken appropriate measures to capture your snapshots and volumes, interacting directly with the write blocked volume in this way is an acceptable approach for performing Incident Response (in my humble opinion).

That’s how I approached sharing a volume from the target environment to my own for imaging and analysis.

Analysis in your target environment

The other scenario you may face is where your client hosts data in regions which are outside of your legal jurisdiction or have non-disclosure agreements or other contractual obligations which will impact on your ability to physically take evidence away from their environment.

This can drastically impact on your ability to stick to the old dead box approach to capturing evidence where you capture the forensic image and download it for offline analysis. I recently worked on a case where no client data (stored in AWS) was to be accessed or taken outside of the client’s offices.

The approach devised involved setting up analysis workstations in multiple regions all over the world to mount volumes from systems which we suspected to be involved in the incident. We had to access these systems from within our client’s offices and through the process, only collect evidence which contained no client data. Essentially, this led to the bulk of our incident response investigation revolving around event logs, registry hives and file system metadata in order to meet these requirements.

This approach is essentially the same as sharing volumes to your own instance, although there are other implications:

1: Hardware dongles  You may wish to use hardware licensed software. We used Virtualhere to share ours up to AWS and this worked exceptionally well, although there were some firewall and routing issues.

2: IT assistance – Like all cases, administrators of the target infrastructure should be your best friends. Chances are you will need a lot of help from these guys when getting their environment configured to work for you.

3: Time – Depending on the amount of evidence you have to capture, time will definitely be against you. This is quite simply due to the way that AWS manages snapshots and volumes. You need to be very meticulous when creating volumes and documenting your actions.

4: Time – Because we never have enough of it…

So that’s a very high-level view of the approach I’ve used for capturing and analysing evidence in AWS.

Reference:

https://docs.aws.amazon.com/AWSEC2/latest/UserGuide/sharingamis-explicit.html


(Not Quite) Snapchat Forensics

Overview

For those of us who don’t have access to those GrayKey boxes or Cellebrite services to acquire physical images of devices, we are generally reliant upon logical extractions of iOS due to legal limitations or similar. After a recent enquiry relating to snapchat data and what was held on a device, I later found out that Snapchat have a download your data service much like Google Takeout.

I had a look into what data is held online and accessible by the user with their basic login. As it happens, as long as you have permission to access the account online, there’s quite a wealth of metadata available.

Points of Interest from an investigative standpoint

I’ve summarised some of the main points I think are interesting. The majority of these I believe would be more useful in criminal matters such as harassment, stalking, sexual abuse or missing person cases but are certainly interesting when considering the lack of available information from the device.

  • Contains Account Creation dates, devices used with the account
    • Useful if there is a dispute over dates of communication and whether there are further devices involved
  • Snap and chat history (no content and goes back at least as far as 1 month back)
    • Shows communication between specific individuals
  • Lists of friends, friend requests sent, friends blocked, friends deleted  (no timestamps)
    • Any of these could be useful in identifying attempted communication or attempted ceasing communication with an individual.
  • Search history (Including search term and Lat, Long coordinates from where those searches were performed)
    • Could indicate some form intent if searching for a specific individual
  • Frequent locations, locations you have visited and Latest location

To download your Snapchat data

  1. Login using account credentials and browse to: https://accounts.snapchat.com/accounts/downloadmydata
  2. Once you’re in, scroll to the bottom of the page and hit ‘Submit Request’
  3. Wait…
  4. You should receive an email to the account used to set up the Snapchat account containing a hyperlink to the download page.
  5. Alternatively, if you log back in the zip file will be available on the /downloadmydata page.

Once you download the data, it’ll be much like the format of a google takeout download, html and JSON.

and that’s it…

If you’re in a bit of a pickle and lacking device data, downloading account data directly from Snapchat may be a second best alternative.

Notifiable Data Breach Statistics

If you’ve been working in Digital Forensics or Incident Response in Australia then you should be aware of the new legislation relating to notifiable data breaches by the Office of the Australian Information Commissioner (OAIC).

In amongst the OAIC’s website, there is some very useful information for incident responders as well as companies who are unsure as to whether they need to disclose when they’ve have had a data breach. You may already work for a mature organisation that has had appropriate legal and technical council in relation to this but if it’s all new to you then I suggest now is a very good time to start reading.

The OAIC outlines a data breach as so:

A data breach occurs when personal information that an entity holds is subject to unauthorised access or disclosure, or is lost.

Personal information is information about an identified individual, or an individual who is reasonably identifiable.[1] Entities should be aware that information that is not about an individual on its own can become personal information when it is combined with other information, if this combination results in an individual becoming ‘reasonably identifiable’ as a result.

A data breach may be caused by malicious action (by an external or insider party), human error, or a failure in information handling or security systems.

Examples of data breaches include:

  • loss or theft of physical devices (such as laptops and storage devices) or paper records that contain personal information
  • unauthorised access to personal information by an employee
  • inadvertent disclosure of personal information due to ‘human error’, for example an email sent to the wrong person
  • disclosure of an individual’s personal information to a scammer, as a result of inadequate identity verification procedures.

The OAIC has recently released quarterly statistics and there are some interesting points which have come out of this.

1: The highest number of individuals affected were 1,000 or fewer across 107 different breaches.

2: It would seem that healthcare organisations are still top of the list for all sorts of targetted attacks in Australia. This comes as no surprise and a statistic that is common in most developed countries.

Investment in security and infrastructure are clearly still lacking in this area since the WannaCry outbreak hit so many systems worldwide.

3: The number of breaches being reported has gradually increased since the start of 2018. Presumably, this will continue to increase.

4: The largest amount of data loss relates to contact information such as names, addresses, email addresses. This is closely followed by financial details. This reflects the businesses which are predominantly targeted (health and finance).

This is also a clear indicator that the low hanging fruit is going to be the most leveraged by attackers. It should come as no surprise that we should expect to see just as many, if not a marked increase in targetted phishing campaigns.

5: Human error still accounts for 36% of data breaches, this indicates there is still a major gap in staff awareness across all industries. Interestingly, the most accidental disclosures happened by PI being sent to the wrong email address but the largest amount of affected individuals was due to loss of paperwork or storage device.

6: 59% of breaches were due to malicious or criminal attacks. Again, this clearly shows there needs to be further investment in education and security.

The highest of these types of malicious or criminal breaches were classed as Cyber Incidents and the breakdown of this can be seen as such:

Compromised credentials being the highest at 34%
Phishing at 29%

I think we know where this is going… Investment in education, training and security.

Some final observations:

  • Questions from clients and their insurers are gravitating more so than ever around what went out the barn door, rather than what led to the door being opened.
  • Phishing is still a huge problem for all industries.
  • Ransomware is largely going unreported. I suspect this may be due to the assumption by many IT vendors when responding is that all ransomware outbreaks are ‘smash and grab’ attempts.
  • Understanding how credentials are compromised and how they are being compromised is still largely unknown in most industries.
  • Reporting is on the increase, this can only be a good thing for the general populous

For further reading:

Click to access notifiable-data-breaches-quarterly-statistics-report-1-april-30-june-2018.pdf

AWS for Forensics (4)

Cloud analysis of local evidence sources

One of the main benefits of analysing evidence in AWS is that we can spin up instances with vast amounts of processing power without too much trouble or cost (in the short term). This can greatly decrease processing time of evidence items and is really useful when you need to determine answers quickly.

A few things that may stand in your way:

  • ISP Bandwidth limitations for evidence uploads
  • Legal or contractual issues around moving evidence into the cloud
  • The sheer volume of evidence for upload

Upload of a local .E01

Presumably, you’ve imaged and hashed your evidence, made sure it’s not encrypted with FileVault or BitLocker and you’re ready to dig in. We can now upload some evidence to our AWS storage volume for analysis.

There are many SSH clients out there which you can use for transferring evidence to AWS, PuTTy being the most commonly used. As I’m an unwashed Mac user, my personal favourite is Cyberduck.

Screen Shot 2018-06-29 at 9.26.50 am

Once we have connected through SSH we can upload our evidence and as you can see this 7GB image is going to take around 30 minutes over a business fibre broadband connection.

Screen Shot 2018-06-29 at 9.36.12 am

Once our evidence is uploaded we, of course, want to hash it again for integrity checks and for continuity.

ubuntu@ip-17x-x1-x-x9:/mnt/evidence$ md5sum Evidence101.E01


We can now get into the fun stuff. 🙂

Screen Shot 2018-05-29 at 9.06.36 pm

Tools like Log2Timeline will work with as many threads as you can allocate and this is where your more beefy instances with more CPU grunt will really shine.

Looking at the Windows options for online analysis, there is obviously a vast swathe of forensic tools which can be run in Windows too. Although, the issue with some Windows commercial forensic packages is their reliance on hardware dongles. No matter, there’s a solution for that too, which involves setting up a local USB server to share the dongle to a remote host.

Enter VirtualHere.

VirtualHere is also a great way to share dongles across systems in your local network too.

So now we have some processed output, we can either analyse this in place using tools installed in our cloud instance or pull it down using our SSH client to our local system.

Next up, I’ll cover the slightly more complex issue of capturing evidence from an AWS instance.

Reference:

https://www.virtualhere.com/

https://cyberduck.io/

https://putty.org/

https://www.forensicswiki.org/wiki/Encase_image_file_format

https://bsmuir.kinja.com/building-a-licence-dongle-server-with-a-raspberry-pi-1678930193

AWS for Forensics (3)

Connecting to an instance and attaching volumes

Connecting to your instance

By now we should have at least one analysis system in our AWS platform for capturing evidence. We will now need to connect through to this system using our key files so we can configure extra storage and with some analysis tools.

If you haven’t already configured key pairs yet you can access these from the EC2 ‘Network and Security’ menu. It goes without saying that once created you should guard your key file with your life.

Once we have our SSL key file, we can follow the standard AWS process for connecting to our instance.

For Linux instances via SSH:

Screen Shot 2018-06-25 at 12.58.47 pm

Or for Windows instances via RDP:

Screen Shot 2018-06-25 at 1.16.50 pm

Attaching Volumes

As previously discussed, we can attach storage volumes for evidence while configuring our instance or create these after the fact through the ‘Volumes’ menu in EC2. We can also use this method to attach a snapshot as a volume to our analysis instance for imaging.

Screen Shot 2018-05-28 at 8.09.43 pm

As with creating new instances, you will want to record the volume name and assign it some tags for tracking storage volumes. You may also wish to use this feature for evidence naming later on when you are acquiring evidence from AWS.

Screen Shot 2018-05-29 at 11.32.36 am

Once you have your volume created you can choose the instance for which to attach it. This is done by selecting the ‘Actions’ button from the ‘Instances’ menu in EC2.

It should be noted that physical device names will need to be defined based on whether your systems are Windows or Linux.

Screen Shot 2018-05-29 at 12.14.42 pm

Our block device should now be attached to our Ubuntu instance now and we can query that by listing block devices in our instance.

Screen Shot 2018-05-29 at 12.25.59 pm

As our instances are virtual in AWS the Xen storage device format is used (this caught me out the first time around). Our last task will be to create a file system on our block device.

Screen Shot 2018-05-29 at 12.29.29 pm

Once we have our new evidence storage volume attached we can create a mount point and mount our block device.

Screen Shot 2018-06-27 at 1.44.21 pm

That’s about it, we now have an Ubuntu instance configured with a secondary EXT4 storage volume which can be used as a target disk for forensic images or for storing other files/forensic tools for analysis.

Next up, taking snapshots of existing volumes attaching AWS volumes for forensic imaging.

Reference:

https://docs.aws.amazon.com/AWSEC2/latest/UserGuide/ec2-key-pairs.html

https://tools.ietf.org/html/rfc1421

https://tools.ietf.org/html/rfc1424

https://docs.aws.amazon.com/AWSEC2/latest/UserGuide/ebs-creating-snapshot.html

https://askubuntu.com/questions/166083/what-is-the-dev-xvda1-device#166087