As i’m sure i’ve mentioned before, event logs are a great source of evidence when performing incident response. In particular, lateral movement can be one of the hardest things to identify when investigating network based intrusions.
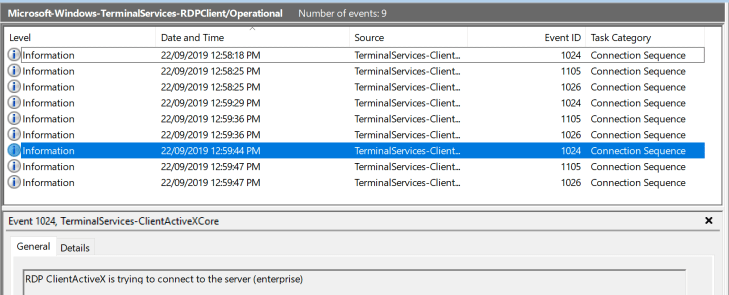
Event ID 1024 in log file Microsoft-Windows-TerminalServices-RDPClient%4Operational.evtx is an event that can sometimes be overlooked and it relates specifically to ActiveX controls in remote desktop.
In built ActiveX controls allow an administrator to configure the RDP user experience by providing scriptable interfaces and can allow embedding RDP ActiveX control in web pages and configuring URL security zones, as a couple of examples.
Event ID 1024 which contains the following message:
“RDP ClientActiveX is trying to connect to the server (IP.ADDRESS OR HOSTNAME)”
Whether IP or hostname display here, will depend on what is entered in “Computer” files in the GUI for remote desktop.
This event ID appears (in testing) to be generated when a user initiates an RDP connection using the RDP client MSTSC.exe in Windows by pressing ‘connect’.
The great thing is, event 1024 entries will be created whether a session is connects or not.
This means while an attacker may not have successfully connected via RDP to another computer, we may still see evidence of their attempts. This log may also persist longer than other logs too, where a Security log may only cover a days worth of activity, you may find months worth of evidence in this log.
When paired with 4648 Security events and other remote computer RDP logs, this can show both attempted or successful connection and authentication to a remote (target) computer.
I recently attended the awesome SANS DFIR, Mac and iOS Forensics and Incident Response course with Sarah Edwards. This has obviously given me lots of great inspiration on how to negotiate Mac analysis in general and to take a closer look at some of those system files that we covered in training.
I’ve spent a little bit of time digging through the log files on my MacBook (Mojave 10.14.2). I’m sure this isn’t new to most practised Unix beards but for those who aren’t aware, there’s a really great little log file called daily.out in /var/log. I had previously given little credence to this log but realised it can be used to determine a whole wealth of useful information. I also reviewed the weekly.out and monthly.out files but these were, in my case, far less granular.
At a high level daily.out contains information relating to disk usage and networking, this file is written at least daily and the configurations for all three of the periodic logs are stored in plist files in the following location:
After reviewing the content of this file, it made me consider how this might assist in some of my casework?
Disk Usage
Firstly, I borrowed some grep skills from a very knowledgeable and tall colleague on my team to see if we could parse out just some specific information from the daily.out file. We extracted the lines only containing the dates, followed by the lines which related specifically to disk usage.
From this, we were able to find entries dating back as early as 3 months, and that the log contains:
Logical volumes mounted at the time entries are written
Size of volumes
Space used on volumes
As you can imagine, disk volume information will be highly valuable in showing drives or images which were attached when the log was written and especially if you know the volume name used by a device you’re looking to prove access to.
We can also ascertain some other information from this log which is quite valuable.
Bootcamp!
You may have an instance where a suspect, subject or general bad person is saying they have never used their Bootcamp install, however, you can see from the Bootcamp disk usage that the volume is being written to and from regularly. Perhaps a big chunk of data has been deleted before a date of interest?
Uptime
Another interesting piece from the daily.out file is that it will show uptime of the system when the log entries are written. This could help prove whether or not the system was switched on and in use over a specific period.
This may also show some interesting information about account usage on the computer. As Mac computers generally tend to be used by individuals, this means there’s usually only ever one account logged on at any time. If you have an experienced user who is elevating to root every day, then seeing multiple accounts logged on may not be uncommon. Although, if an inexperienced user who has no knowledge of the root account, is logged on many times when another account is logged on, it may be suspicious or warrant further analysis.
Again, we extracted the lines from the daily.out file we are interested in using a simple grep command:
As you can see we can pull some interesting information about computer and account usage:
Shows uptime of the system at the point in which the daily.out entry is written
Also shows the number of users logged on, remember this is usually going to be one
There are also some very useful network interface statistics listed in this file which are probably more relevant to IR investigations but we may look at these another time.
For those of us who don’t have access to those GrayKey boxes or Cellebrite services to acquire physical images of devices, we are generally reliant upon logical extractions of iOS due to legal limitations or similar. After a recent enquiry relating to snapchat data and what was held on a device, I later found out that Snapchat have a download your data service much like Google Takeout.
I had a look into what data is held online and accessible by the user with their basic login. As it happens, as long as you have permission to access the account online, there’s quite a wealth of metadata available.
Points of Interest from an investigative standpoint
I’ve summarised some of the main points I think are interesting. The majority of these I believe would be more useful in criminal matters such as harassment, stalking, sexual abuse or missing person cases but are certainly interesting when considering the lack of available information from the device.
Contains Account Creation dates, devices used with the account
Useful if there is a dispute over dates of communication and whether there are further devices involved
Snap and chat history (no content and goes back at least as far as 1 month back)
FTK Imager is renowned the world over as the go-to forensic imaging tool. While working in law enforcement I was always obsessed with ensuring I had captured the ‘golden forensic image’ which for obvious reasons, is still ideal and gives you all that unallocated spacey goodness.
But…
Modern day forensics and IR require answers. Quick!
As we all know, things have moved on quite rapidly from grabbing an image of a dead box and leaving it processing in your tool of choice over the weekend. This is mainly due to the issue that most units have; backlogs, lack of time and urgency to produce results. Whether it’s management in Law Enforcement looking for the silver bullet ‘Find Evidence’ button in Axiom (no digs at Magnet but please put that back in :)) or the large corporations incident responder needing to analyse hundreds of endpoints for one specific artefact.
Now, I’m not saying FTK Imager is about to answer either of those questions for you but there are some handy functions which I had never used until recently.
Custom content images in FTK Imager allow the analyst to add an evidence item and build a logical image (AD1… sorry XWF users) containing only files of their choosing.
This can be handy for a few reasons.
Perhaps time to capture evidence is limited.
This could involve accessing a users laptop remotely while it is only attached to the network for a short time. This may not be lawfully permitted in your country.
You could have been given a computer with no PSU and need to acquire evidence from it before the battery dies (as I once had to do in the back of a $380 taxi journey).
In the law enforcement world, there are any other numbers of reasons why you may be tight on time.
You have strict instructions on what to acquire.
You might only have legal permission to or have been asked to only extract specific files types.
You are capturing evidence from a shared computer and are only allowed to extract files specific to a user account due to legal privilege.
Here are some simple ways around some of these problems using FTK Imager, presuming you are working with Windows computers or existing images.
Custom Content Image by File Type
FTK Imager allows the use of Wild Cards to filter and find specific files stored on the file system. This is a great feature if you are looking for a file by name*, extension or batch of files with similar names.
* Noting that files by name may not meet all matching files in the way that hashing will.
Wild Card Syntax:
? = Replaces any single character in the file name and extension
* = Replaces any series of characters in a file name and extension
| = Separates directories and files
Wild Card Filters:
Users|*|NTUSER.dat
Users|*|Documents|*.doc
Users|*|Downloads|Evidence ?.pdf
Windows|Prefetch|*
1: Start by browsing to your custom content item.
2: Then right-click and select add to “Custom Content Image”.
3: You can manually add custom content by selecting “New” using the wildcard option or “Edit” existing custom content.
*As far as I’m aware, there is not an option to save your custom content as a template.
(Please let me know if you do, as I currently just use a text file as a template for files of interest for varying investigation types)
Creating Content Image by User SID
As previously mentioned, your scope may be limited due to shared computer use and while this may not be of too much importance for law enforcement, files belonging to a user may be marked as privileged by civil court orders.
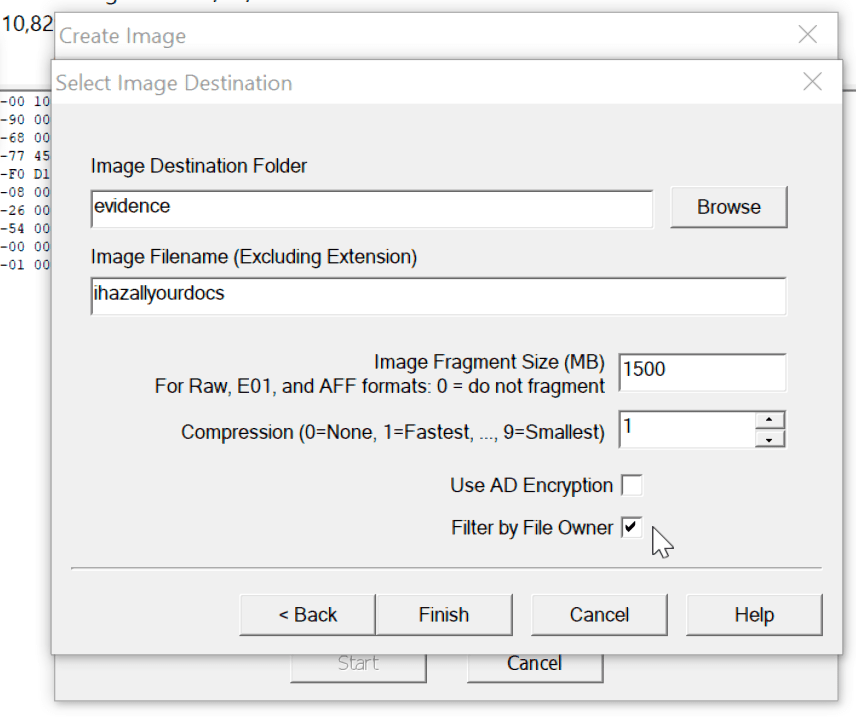
We can use FTK Imager to create an image of only files owned by a specific users SID, the process is just as we defined previously but upon creating the custom content image you need to select the tick box to “Filter by File Owner”.
Once you have selected this, you will be presented with the respective file owners and their SID’s on the system.
Collection for Incident Response
The last instance where these methods may be useful is if you have a handful of workstations where you need to collect some very specific files or artefacts from. I tend to use a text file as a template. Although this works, it is a bit clunky and slow.
There are a great many other commercial and open source tools which can already perform these tasks extremely well, such as f-response, X-Ways Forensic, GRR and so on. This option also doesn’t really work for incident response at scale but if you’re stuck without your commercial tools or have a very targeted approach for collections from a few computers, then this could work for you.
FTK Imager also comes in a lite flavour which doesn’t require any installation. 🙂
In digital forensics, hashing is generally used as a method of verifying the integrity of a forensic image or file. The MD5 algorithm has become the accepted standard and used worldwide. Without getting into a long conversational piece about hash collisions and other more reliable and faster methods, MD5 for most purposes is still sufficient.
File hashing has had a long grounding in Law Enforcement cases to identify known good and known bad sets of image file hashes.
Known good hash sets allow an analyst to reduce their data set within their forensic evidence dramatically by removing any files/images related to software and operating systems. NIST has kept the NSRL hash sets updated for a number of years and these among others are widely used to perform this function.
Known bad hashes of images, particularly for indecent image cases are more controversial and have led to many a late-night discussion over how these should be used, managed and categorised.
The major benefit of generating known bad hash set(s) for indecent image cases, is that you are minimising the exposure of the material to the analyst. I believe having a centralised (accurate) hash database to be of utmost importance for the sanity of all those individuals who spend their time categorising images.
The other knock-on effect of using hash sets is that it decreases the analysts time to complete their work, which for overburdened Cybercrime units can only be a blessing.
File hashing can also be used to differentiate files across multiple sources, identifying specific files across evidence sources and assisting with identifying malware (although this is not a full proof approach for malware analysis).
Anyway, on to how we can utilise hashing in X-Ways Forensics.
Hashing in X-Ways Forensics
I’ll start off by making the assumption that you have a basic understanding of how to use X-Ways.
First, you will need to establish a storage location for your hash database(s). X-Ways comes with the option to configure two different databases, this can be useful if you have hashes using different algorithms such as MD5 or SHA1.
Another consideration when configuring the storage location is speed, configuring your databases on an internal SSD RAID would be optimal if you are going to run this locally.
To configure your hash database locations select the following in X-Ways
Tools > Hash Database
Once you have created the databases in your desired locations. You can start to import your hash sets.
You could also create your own hash sets from known good or bad sources, I tend to install fresh offline copies of Windows and create sets from these as I know I can thereafter speak to their integrity. You can also assign a category or hash set name during import, this can be extremely useful when performing differentials.
Please note that if you create any sets from your evidence after your initial hashing you will need to rehash the evidence in order for the new results from these sets to appear.
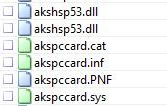
As you can see from the screenshot below we already have a couple of hash sets added to our database.
Once you have your database configured you can proceed and hash your evidence using the refine volume snapshot feature. This can be done across an entire volume or selected files only.
To perform this function select the following options:
Specialist > Refine Volume Snapshot > Compute Hash + Match against hash database
Once hashing has completed, files which have matched a set can be identified by the light green colour of the file icons.
You now need to configure the directory browser to see the hashes, sets and categories.
This can be done by selecting:
Options > Directory Browser
You will now need to set the directory column size, once this has been set you can adjust by dragging the columns wider or narrower to suit your needs.
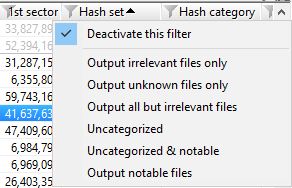
After these views have been enabled through the directory browser we can start filtering within X-Ways. From the hash set column, we can enable or disable the ‘NOT’ function to exclude particular hash sets…
.. and from the category column, we can show or hide irrelevant, relevant, notable or uncategorised hash categories.
This approach combined with the other filtering functions in X-Ways allow the examiner to cut and dice their output quite extensively. Outputting the directory browser view including the hash sets and categories to csv can allow further review in Excel if that tends to be your tool of choice. This can then quite easily be delivered as a product in your casework.
That’s really it for how I tend to uses hashes in X-Ways.
Useful links and videos for further reference on hashing:
As you may be aware, there is already a plethora of forensic tools available for producing system timelines, all with their own capabilities and some with limitations. From Sleuth Kits FLS/Mactime, Plaso/Log2timeline, XWF, Axiom, Encase and more recently Timeliner for Volatility. I’m sure many more have performed this function to varying degrees over the years but Microsoft hasn’t been one, until now.
Last patch Tuesday, Microsoft released Windows 10 update (1803) which has brought along a number of new features including a new Timeline function, which allows users to look back in time at their previous activities.
This got me thinking.
A built-in Windows utility which shows linear recent activity (within thirty days) on a computer system and runs under user context.
Very interesting… Let’s take a look!
File Creation/Opening
First I had to find out where Windows tracks all of this activity. A simple keyword search for a sample document name ‘This is a test document.docx’ exposed the following file as a potential area of interest:
Now, SQL is not my forte so I had a pretty rudimentary poke around by parsing it out to csv to see what I could find. The database file contains a number of tables and of initial interest, I would highlight the ‘Activity’ and ‘Activity_PackageID’ tables for a first look to interrogate this file.
Windows 10 Timeline
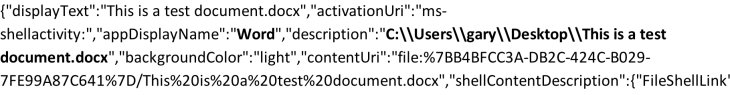
In the ‘Activity’ table under ‘AppID’, Microsoft Word can be seen as the application used to open the file.
From the ‘Payload’ entry you can identify further display options for the Timeline entry, including ‘Word’ and the display text being the filename.
Timestamps
Other notable entries found in the Activities Cache database are the associated timestamps. For our test document mentioned above, you can see the following timestamps which are stored in Unix format within the ActivitiesCache.db file:
Last Modified: Tue, 1 May 2018 20:28:18
Expiration Time: Thu, 31 May 2018 20:28:18
Start Time: Tue, 1 May 2018 20:28:18
Last Modified on Client: Tue, 1 May 2018 20:28:18
After some testing, I identified that the expiration time is as expected, thirty days from the entry start time. The timestamps do not appear to be updated after a file is deleted although the deleted file will remain visible in the Timeline (presumably for up to thirty days or when the database is purged). Timestamps do not appear to be updated within a twenty-four hour period, after modification to files.
Program Execution
The ‘Activity_PackageID’ table contains entries for applications which include paths for executables, executable names and also the expiration time for these entries. This activity not only shows applications that were executed within the last 30 days but by backdating the expiration timestamp, you may be able to identify a time when that application was run and by which user. This can obviously be correlated with other artefacts such as prefetch.
This is just some initial testing and there is a wealth of further information in this file which will need further analysis to decode fully. It’s certainly nice to see some new functionality in Windows which not only serves a meaningful purpose for the end user but also provides examiners with another artefact showing user interaction, web browsing activity, program execution, file opening and creation.
Update:
Eric Zimmerman has written a tool now to parse this database and you can find that along with all his other amazing tools, here: